
Where Tigers Still Roam: A Forest Growing Against the Odds
Eleven years of satellite data reveals Karnataka's protected forests are not just surviving—they're thriving
Somewhere in Karnataka right now, the sun is rising over ancient forests.
A tiger moves through morning mist, paws silent on leaf litter. An elephant strips bark from a tree, part of a routine older than human memory. A leopard settles into thick canopy for a day's rest. The dawn chorus begins—hundreds of bird species announcing another day of life in the Western Ghats.
These animals know nothing of conservation policy or protected area management. They simply know there is forest.
And that forest—against all odds, despite relentless pressures, through decades of challenges—is still there.
Not just surviving. Growing.
A Landscape Under Siege
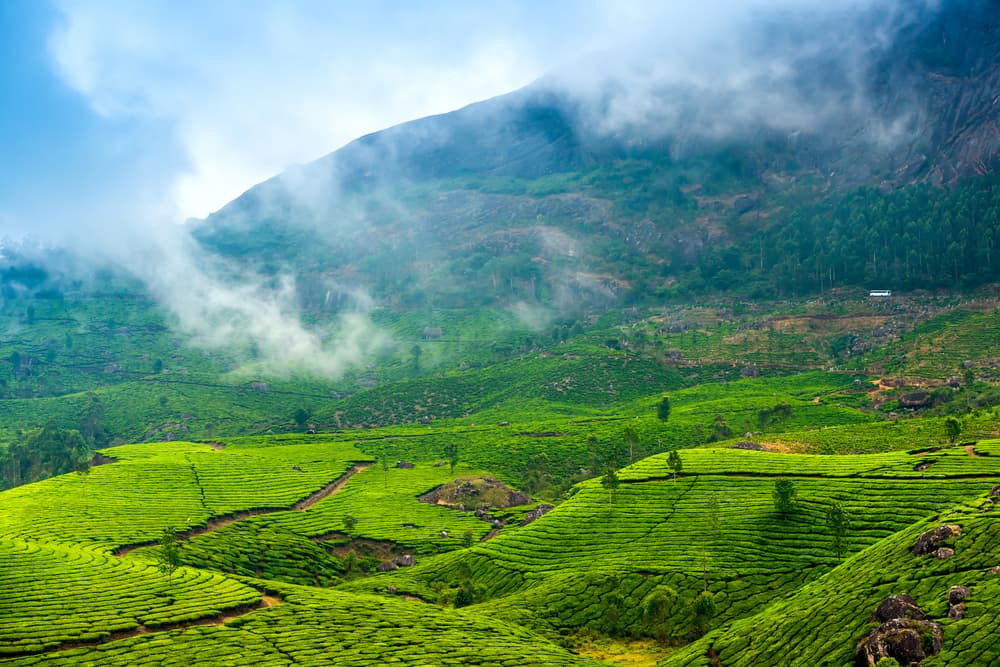
The Western Ghats have stood for 150 million years. They've witnessed the rise and fall of dinosaurs, survived ice ages, and watched human civilizations come and go. But the past century has been different.
By the 1970s, India's forests faced their greatest crisis. Tiger populations crashed from 40,000 to fewer than 1,400. The Western Ghats—one of eight global biodiversity hotspots—faced mounting pressure from development, agriculture, and a human population growing from 350 million to over a billion.
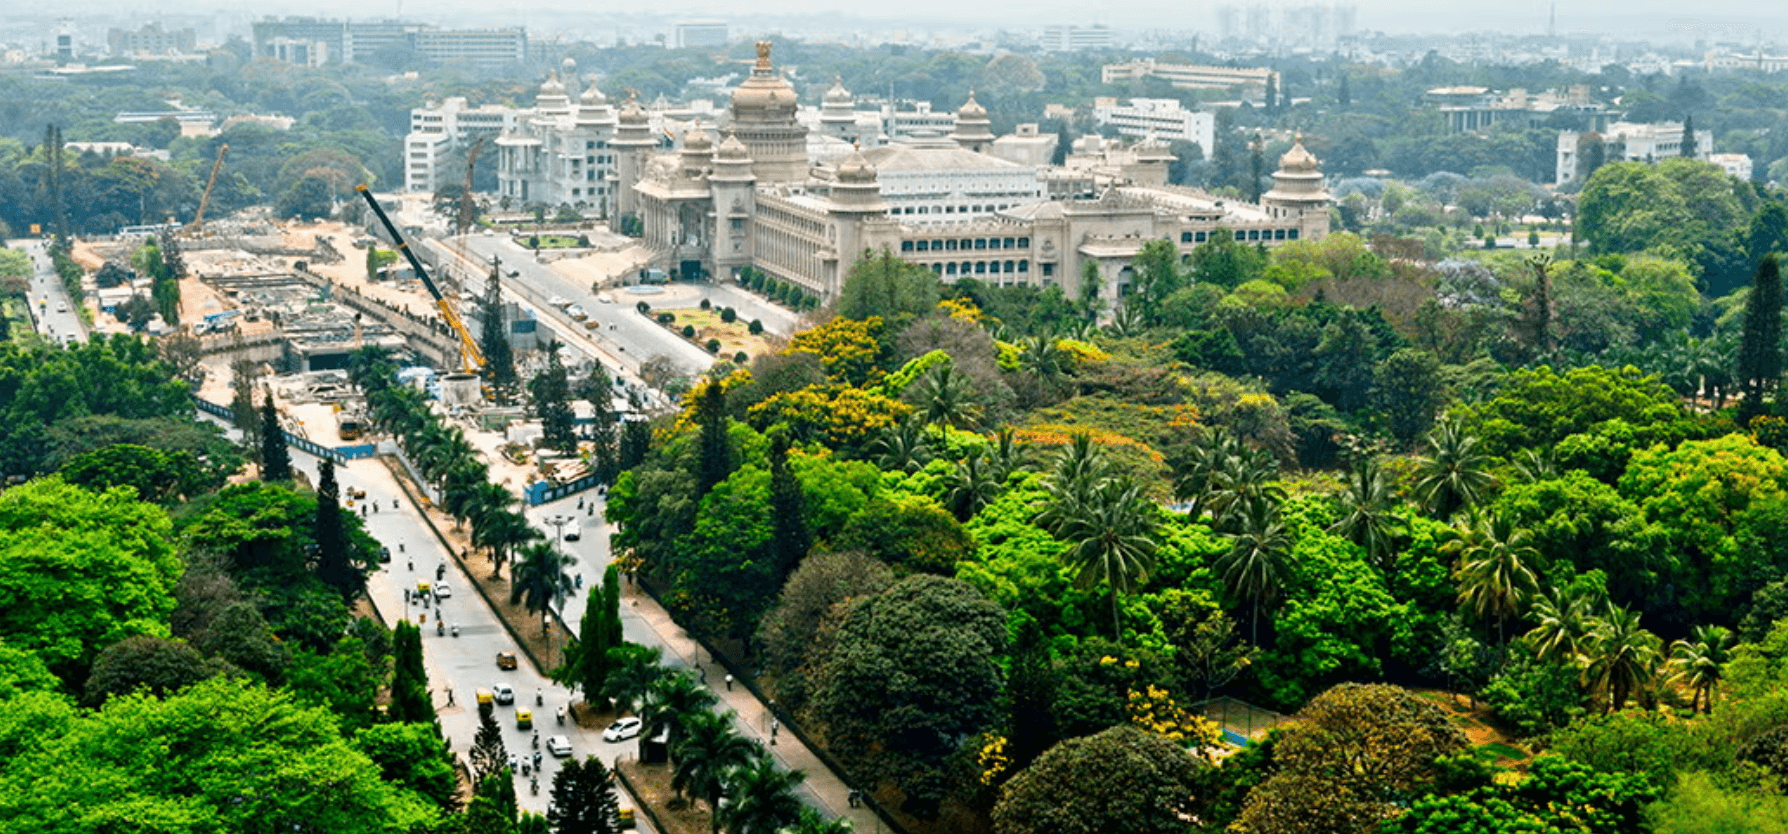
Karnataka, a state in the heart of these mountains, epitomizes the challenge. With 65 million people, expanding cities, and an economy hungry for land, forest coverage across the state hovers around 20%—below the national target of 33%.
Yet within this landscape of loss, something unexpected has been happening.
The Protected Network
Across Karnataka lies a network of conservation areas: protected forests, tiger reserves, and wildlife corridors connecting them. Together, they cover 12,589 square kilometers—roughly 6.6% of the state.
These aren't pristine wildernesses untouched by humans. Villages dot the edges. Roads cut through in places. People live and work in surrounding areas. These are working landscapes, not museum exhibits.
But they have legal protection. Boundaries that prohibit tree cutting, agricultural expansion, and industrial development. Rangers who patrol, prevent poaching, and manage fires. Funding that, while never quite enough, keeps the system functioning.
The question that has lingered for years: Does any of this actually work?
What the Satellites Witness
Satellites circle Earth silently, recording truth without bias. They capture what is, not what we wish or fear.
Eleven years of satellite imagery—from 2013 to 2024—tells a story rarely heard in conservation: recovery.
Multiple independent satellite systems, from European and American space agencies, painting the same picture across different sensors, different resolutions, different methodologies.
The data is consistent. The trend is clear.
The Numbers That Matter
Forest coverage in Karnataka's protected areas: 75%
Three-quarters of this conservation landscape is forested. Not 20% like the state average. Not 33% like the national target. But 75%.
But more striking is the change over time.
2013: 6,401 square kilometers of forest 2024: 7,073 square kilometers of forest
A gain of 671 square kilometers over eleven years. Roughly 61 square kilometers per year—about the size of Manhattan—returning to forest, year after year.
Not a steady line upward. Some years showed setbacks. 2016 was particularly difficult, likely drought-related. But the overall arc bends toward recovery.
The largest single-year increase came between 2020 and 2021: 355 square kilometers in twelve months. Whether from reduced human pressure during COVID lockdowns, an exceptional monsoon, or accumulated conservation efforts reaching critical mass—the forest responded.
Beyond Area: The Quality of Life
Square kilometers tell only part of the story. A forest can be technically alive yet barely surviving—sparse coverage, stressed trees, degraded soil.
But satellite vegetation indices reveal something different here.
Vegetation vigor: 0.665
On a scale where anything above 0.6 indicates excellent health for tropical forests, these trees are actively thriving—photosynthesizing robustly, growing vigorously, supporting complex life.
Canopy structure: 76% good to dense coverage
Over a third of the forest (34%) has dense, multi-layered canopy where sunlight barely reaches the ground. Another 42% maintains moderate coverage. This is the structure wildlife requires—deer hiding in understory, birds nesting in multiple layers, predators hunting in shadows.
Landscape integrity: 86% core habitat
Perhaps most critically, these are not forest fragments. Rather than scattered pieces vulnerable to edge effects and isolation, 86% exists as core forest—more than 100 meters from any edge. The core-to-edge ratio of 6.3:1 indicates large, intact blocks where forest processes function normally.
Stress indicators: <1%
Less than one percent of the forest shows signs of degradation or stress. In a world facing climate change, droughts, and pollution, this resilience is remarkable.
Overall assessment: 88 out of 100
Not surviving. Thriving.
What Enables Recovery
Forest regrowth doesn't happen by chance. Specific conditions must align.
Protection With Teeth
Legal designation means nothing without enforcement. These areas have rangers walking patrols through monsoon rains, camping in uncomfortable conditions, confronting armed poachers. They maintain fire lines, protect boundaries, prevent illegal logging.
Unglamorous work. Daily effort. Year after year.
It works.
Connection, Not Isolation
The wildlife corridors proved crucial. Rather than isolated forest islands slowly dying from genetic bottlenecks and disrupted ecology, these corridors link everything into a functioning network.
Tigers move between reserves. Elephants follow migration routes used for millennia. Seeds disperse across distances. Gene flow continues. The forest breathes as one organism rather than suffocating in fragments.
Space to Simply Be
In unprotected areas, every square meter faces constant pressure—someone wanting to farm it, build on it, extract from it.
In protected areas, forest gets what it needs most: time and space to follow its own rhythms. Trees grow at their natural pace. Clearings fill in without forced intervention. Ecological succession proceeds uninterrupted.
The Power of Time
The 2024 forest includes trees that were saplings in 2013, seeds in 2010, parent trees decades before that. Forest recovery operates on different timescales than human planning cycles.
A 50-year-old tree didn't grow overnight. This 671-square-kilometer gain represents accumulated protection, sustained management, and natural processes given room to work.

Who Benefits
When forest recovers, entire ecosystems follow.
Tigers Need Territory
A female tiger requires 40 to 60 square kilometers. Males need 60 to 100. They need abundant prey—deer, wild boar, smaller mammals. Water sources. Dense cover for hunting. Space to raise cubs without constant human conflict.
A landscape with 75% forest coverage, low fragmentation, and growing area provides all of this.
India's tiger population has climbed from fewer than 1,400 in the 1970s to over 3,000 today. Karnataka hosts a significant portion. This forest recovery underpins that success.
But Not Just Tigers
These forests support:
Asian elephants following ancient migration routes
Leopards in dense forest patches
Endangered wild dogs (dholes) hunting in coordinated packs
Over 500 bird species
Countless reptiles, amphibians, insects
Entire ecosystems of organisms science barely understands
The principle of umbrella species holds: protect what tigers need, and thousands of other species benefit.
The Paradox of Protection
Zoom out to the state level, and a different picture emerges.
Karnataka as a whole lost forest during this period. Cities expanded. Agriculture spread. Development happened. Net forest cover declined.
Yet within that broader loss, pockets of recovery exist. Islands where forest actually grew.
Those islands are, not coincidentally, the protected areas.
This isn't contradiction. It's a controlled experiment playing out across an entire state:
Unprotected land: Forest declines under development pressure Protected land: Forest recovers despite surrounding development
The variable: protection. The result: 671 square kilometers of difference.
What Forest Provides
These aren't merely trees. This is:
Climate Regulation
Every hectare of tropical forest sequesters 5-10 tons of carbon annually. The 671 square kilometers of recovered forest removed millions of tons of carbon dioxide from the atmosphere over the decade.
Forest transpiration creates local rainfall patterns. Remove forest, disrupt the rain that millions depend on. Maintain forest, stabilize climate systems.
Water Security
These forests function as massive sponges—absorbing monsoon rains, releasing water gradually through dry seasons, recharging aquifers, preventing both floods and droughts.
Cities and farms downstream depend on this regulation. Without forest, rivers become torrents in monsoon, trickles in summer.
Biodiversity Reservoir
The Western Ghats harbor species found nowhere else on Earth. Endemic frogs that live in single valley systems. Plants that exist only on particular mountain slopes. Genetic diversity refined over millions of years.
Lose the forest, lose these species. Forever. No recovery possible.
Cultural Heritage
Indigenous and traditional communities have lived with these forests for thousands of years. Sacred groves hold spiritual significance. Traditional ecological knowledge spans generations. Cultural practices tie directly to the land.
Forest loss erases not just ecology but human heritage.
The Human Element
Easy to discuss forest as if it exists separate from people. But every hectare of protected forest represents human choices.
Funding ranger salaries instead of other priorities. Enforcing boundaries despite political pressure. Prosecuting poachers despite danger and corruption. Maintaining fire lines through tedious labor. Restoring degraded areas with patient effort.
Conservation isn't nature happening automatically. It's humans deciding nature matters, then doing daily work to make that real.
Rangers patrolling in heat and rain. Forest officers managing budgets and staff. Researchers monitoring wildlife. Local communities navigating complex relationships between conservation and livelihood. Politicians maintaining funding despite competing demands.
This forest recovery represents thousands of decisions, accumulated over eleven years, by people who believed it mattered.
The data proves they were right.
The Timeline of Change
2013-2015: Baseline establishment. Forest coverage relatively stable around 6,400-6,600 square kilometers.
2016: Significant decline to 6,305 square kilometers. Likely drought-related. A reminder that recovery isn't linear.
2017-2019: Rebound begins. Forest climbs back through 6,400, then 6,600, approaching 6,700 square kilometers.
2020-2021: Dramatic surge. Forest jumps to 6,946, then 7,301 square kilometers. The largest single-year gain: 355 square kilometers. Something shifted—pandemic effects, exceptional weather, or accumulated conservation reaching threshold effects.
2022-2024: Some fluctuation—life never follows perfect trajectories—but maintaining gains. Ending 2024 at 7,073 square kilometers.
The pattern: after stress in 2016, not just recovery but expansion beyond baseline. And sustaining those gains.
Validation From Multiple Sources
Science requires verification. Extraordinary claims demand extraordinary evidence.
Multiple independent satellite systems confirmed these trends:
ESA WorldCover (10-meter resolution, European Space Agency)
MODIS MCD12Q1 (500-meter resolution, NASA, 20+ year archive)
Sentinel-2 (vegetation health monitoring, 10-meter resolution)
Google Dynamic World (AI-based classification, near real-time)
Different sensors, different algorithms, different methodologies—all telling consistent stories.
Additionally, India's official Forest Survey reports validate that Karnataka's protected areas gained forest while the broader state showed mixed results. Independent confirmation of satellite findings.
The data is robust. The trends are real.
What This Means
In an era of relentless environmental decline, this landscape offers something different: proof that recovery is possible.
Not everywhere. Not automatically. Not without sustained effort and resources.
But possible.
The Western Ghats faced the same pressures as forests worldwide: growing human population, economic development, agricultural expansion, climate change. Yet here, within a framework of protection, connection, and management, forest grew.
If recovery can happen in Karnataka—a state with 65 million people and massive development pressure—where else might it be achievable?
The tools exist. The methods work. What's often missing isn't knowledge but political will and adequate resources.
The Caveats
Scientific integrity requires acknowledging limitations.
Satellite Accuracy
Classification algorithms typically achieve 85-90% accuracy. The precise numbers—671 square kilometers rather than 650 or 700—carry uncertainty. But the directional trend—growth rather than loss—is robust across multiple systems.
What Satellites Cannot Measure
Orbital imagery reveals forest extent and health but not:
Exact tiger population numbers (requires camera traps)
Water quality (requires field sampling)
Soil health (requires ground surveys)
Invasive species dynamics
Many biodiversity metrics
This analysis provides one lens. Complete understanding requires ground-truthing, long-term monitoring, and multiple data sources.
Temporal Limitations
Eleven years captures recent trends but not long-term cycles. What happens over 50 years? 100? How will climate change impact these patterns?
Unknown. Continued monitoring essential.
Ongoing Threats
Forest grew from 2013-2024. Nothing guarantees continuation. Protection can weaken. Funding can be cut. Political will can fade. Climate change can overwhelm everything.
These gains are conditional on continued effort.
Looking Forward
This analysis looked backward—what happened from 2013 to 2024. But the relevant question looks forward: what happens next?
The trajectory could continue upward. Improved management, expanded corridors, increased funding could accelerate recovery.
Or the trajectory could reverse. Weakened protection, reduced resources, political pressure, climate shocks could erase gains quickly.
Forest recovery is not a permanent state. It's an active process requiring sustained commitment.
The next decade will reveal which path Karnataka takes.
A Different Narrative
The dominant story about tropical forests goes: "Destruction is inevitable. We're losing. It's too late."
In many places, that's accurate. Global deforestation is real and urgent.
But that's not the only story.
Here's another: "Protection works. Management matters. Connection enables recovery. Time allows healing."
Not everywhere. Not always. Not without effort.
But in this landscape, during this decade, with this approach... it worked.
That matters not because it solves everything but because it proves something: recovery is achievable.
When headlines scream only doom, evidence of success becomes precious. Not to encourage complacency but to demonstrate that effort yields results.
Conservation isn't futile. It's difficult, expensive, and requires persistence. But it works.
The Complete Picture
For those who work with data, the full accounting:
Study Area:
Size: 12,589 square kilometers
Location: Karnataka state, Western Ghats mountains
Components: 95 protected features (areas + reserves + corridors)
Time period: 2013-2024 (11 years)
Forest Coverage:
ESA WorldCover 2020: 75.1% (9,448 km²)
ESA WorldCover 2021: 76.1% (9,584 km²)
Year-on-year change: +136 km² (+1.44%)
State average for comparison: ~20%
Eleven-Year Trend:
MODIS 2013 baseline: 6,401 km²
MODIS 2024 current: 7,073 km²
Net change: +671 km² gain
Average annual: +61 km²/year
Pattern: 8 of 11 years showed gains
Health Metrics:
Overall health score: 88/100 (excellent)
Vegetation vigor (NDVI): 0.665 (excellent)
Dense canopy (>70%): 4,242 km² (34% of forest)
Moderate canopy (40-70%): 5,262 km² (42% of forest)
Sparse canopy (20-40%): 1,498 km² (12% of forest)
Core forest (>100m from edge): 8,333 km² (86.3%)
Edge forest (<100m): 1,322 km² (13.7%)
Core-to-edge ratio: 6.3:1
Stressed/degraded areas: <0.1%
Data Sources:
Conservation boundaries: National Tiger Conservation Authority (NTCA)
Forest classification: ESA WorldCover v200 (10m)
Temporal trends: MODIS MCD12Q1 v061 (500m)
Vegetation health: Sentinel-2 Harmonized
Canopy density: Google Dynamic World
Validation: Forest Survey of India (FSI) reports
Methodology: All analysis conducted using Google Earth Engine. Multiple independent satellite systems for cross-validation. Results validated against official government forest statistics.
What the Forest Teaches
Perhaps the most important finding transcends numbers.
Nature, given the smallest opening, responds.
Stop cutting trees → they grow back. Stop lighting fires → saplings survive. Protect corridors → animals use them. Provide time → ecosystems heal.
Humans didn't create these 671 square kilometers of forest. Natural processes did. What humans contributed was negative space—stopping the destruction, preventing the cutting, halting the burning.
The forest did the rest.
This reveals something fundamental: nature's default state is growth and regeneration. Decline requires continuous pressure. Remove the pressure, and recovery begins.
We don't need to make forests grow. We need to stop preventing them from growing.
The Daily Reality
Abstract back to the concrete:
Right now, in those 7,073 square kilometers:
Trees are photosynthesizing, converting sunlight to life. Fungi are decomposing fallen leaves, cycling nutrients. Insects are pollinating flowers, ensuring next year's seeds. Birds are dispersing fruit, planting tomorrow's trees. Predators are hunting prey, maintaining population balances. Rivers are flowing through forest, staying cool and clean.
And tigers are walking ancient paths, raising cubs in dens hidden deep in recovered forest, completely unaware that:
Satellites photographed them from space. Computers analyzed vegetation patterns. Scientists validated conservation approaches. Reports documented success.
The tigers just know there's forest.
Enough forest to hunt in. Enough forest to hide in. Enough forest to raise the next generation in.
That's what matters.
The Closing Thought
This is a story about 671 square kilometers and eleven years.
But really, it's a story about resilience.
Forest resilience—the capacity to recover when given opportunity. Ecological resilience—the ability of systems to reorganize after disturbance. Conservation resilience—the persistence of effort despite setbacks.
And perhaps most importantly, hope's resilience—the stubborn refusal to accept that decline is inevitable.
The Western Ghats have stood for 150 million years. They'll stand longer.
But whether they stand as degraded fragments or thriving ecosystems depends on choices made daily by people who may never walk through these forests themselves.
Rangers protecting boundaries. Politicians allocating budgets. Communities respecting conservation. Citizens supporting protection.
Those choices created 671 square kilometers of recovery.
What could the next decade bring?
Further Information
Data Transparency: All methods documented. All data sources publicly available. Analysis code available upon request for verification and replication.
Sources:
National Tiger Conservation Authority: ntca.gov.in
Forest Survey of India: fsi.nic.in
ESA WorldCover: esa-worldcover.org
NASA MODIS: lpdaac.usgs.gov
Support Conservation: Organizations working to protect Western Ghats forests depend on public support. Research, donate, or simply share their stories.
Disclaimer: This analysis uses publicly available satellite data. For official forest statistics, refer to Forest Survey of India reports. Analysis represents independent research and does not represent official positions of government agencies.
For the tigers walking through morning mist. For the forests growing in silence. For everyone who believes recovery is possible.
December 2024
A Final Image
Dawn breaks over Karnataka.
Mist rises from valley floors. Sunlight filters through dense canopy. A tiger's paw prints mark soft soil—evidence of passage through forest that, by all predictions, shouldn't be here anymore.
But it is here.
Still growing. Still breathing. Still home.
That's the story satellites tell. That's the truth worth sharing. That's the hope worth protecting.
Analysis conducted 2024 using Google Earth Engine and multiple satellite systems. All data publicly available. Methods documented for transparency and reproducibility.