Bangalore Lost One-Third of Its Green Cover in Just 8 Years
The Silicon Valley Paradox: An Ecological Audit
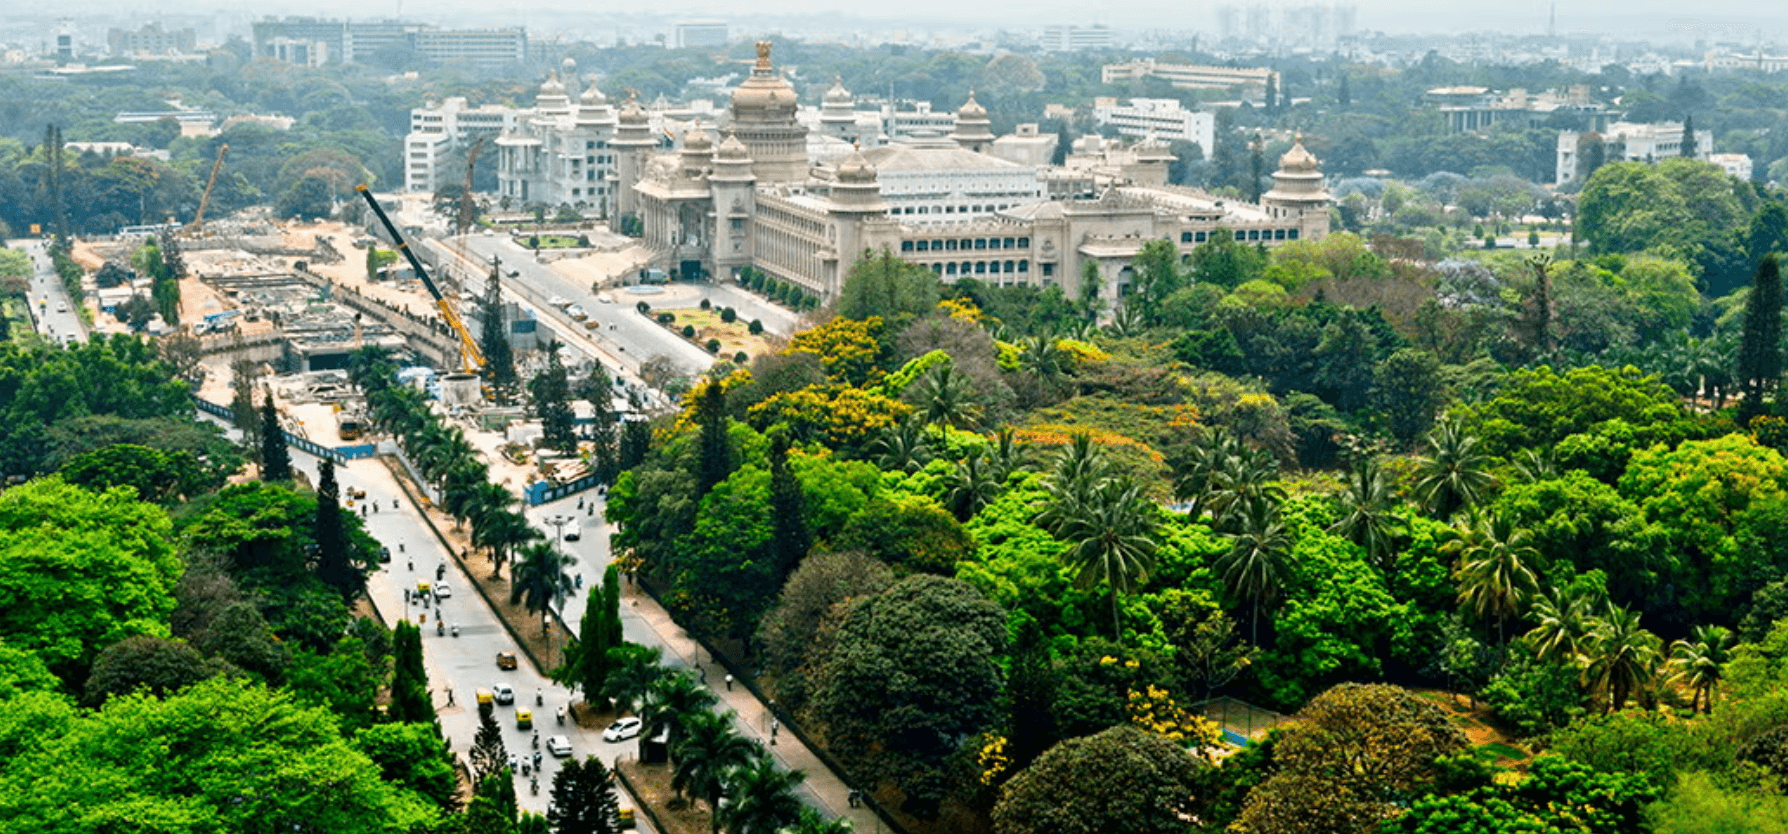
Bangalore is currently running a massive ecological deficit. While the city’s economic metrics have soared, a silent audit conducted from orbit reveals that its environmental capital is being liquidated at an unsustainable rate.
This isn’t just about "fewer trees"; it is a structural transformation of the city's land surface.
The Satellite Evidence
The story begins 786 kilometers above Earth. Using European Space Agency’s Sentinel-2 satellites and Deep Learning AI models, researchers stripped away the anecdotes to look at the raw pixels. The objective was to classify every 10-meter patch of ground in the Bangalore Urban district from 2017 to 2024.
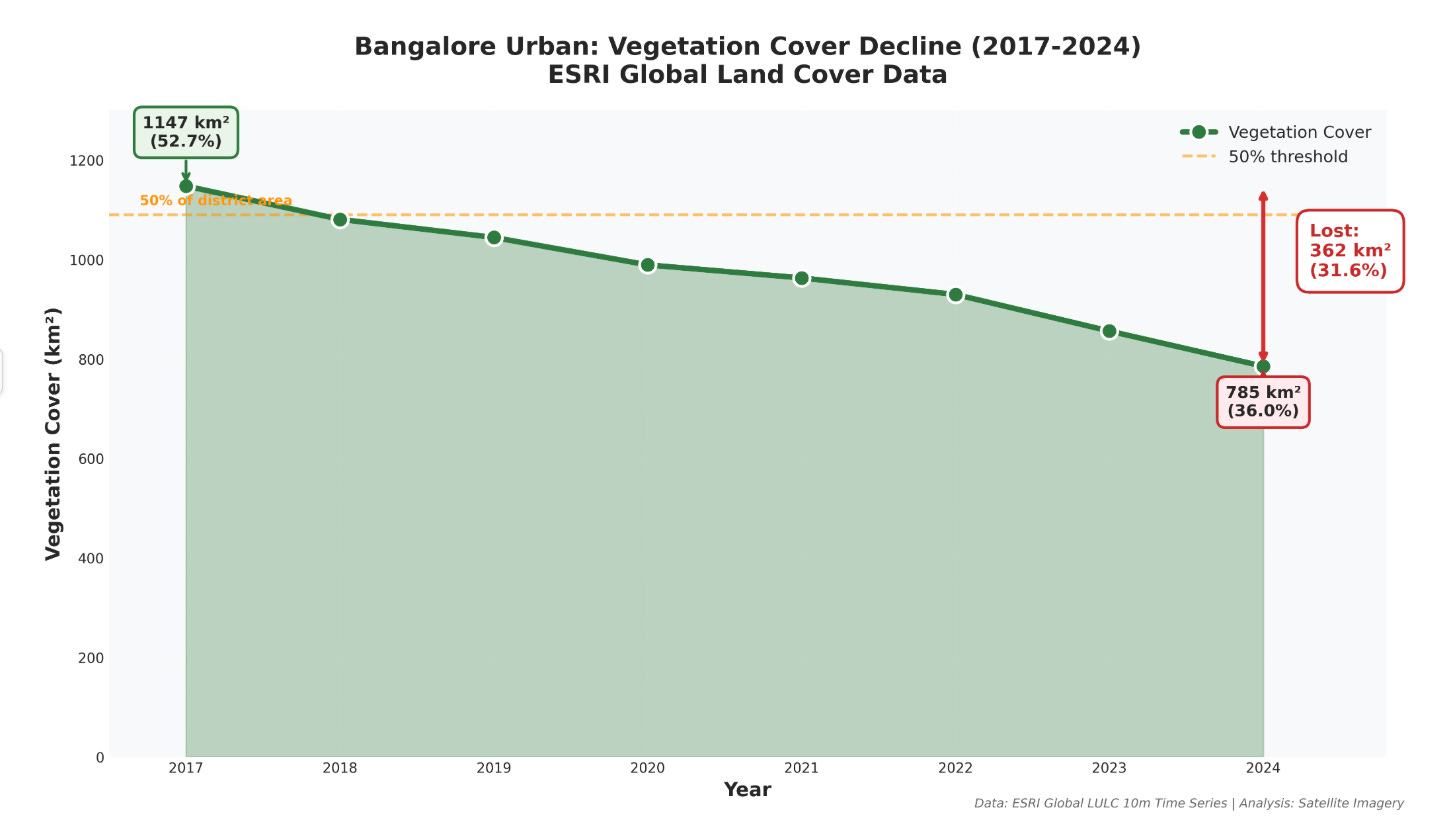
The resulting dataset offers a high-resolution timeline of urbanization. In 2017, vegetation (trees, crops, scrubland) held the majority stake in the district at 52.7%. By 2024, that majority was lost, shrinking to just 36%.
The 20:1 Asymmetry
The most critical insight from the data is not the total loss, but the inefficiency of replacement.
Urban planning often promises "compensatory afforestation"—planting new trees to replace old ones. However, the spatial analysis exposes a massive gap between policy and reality. For every 1 square kilometer of new vegetation gained in the last eight years, the city simultaneously destroyed 20 square kilometers of existing cover.
This 20:1 ratio suggests that "greening" efforts are statistically negligible compared to the velocity of concrete expansion.
The Acceleration Curve
Standard urban development usually follows an S-curve—rapid growth followed by stabilization. Bangalore, however, is still in the exponential phase of land conversion.
Phase 1 (2017–2020): The city consumed ~51 km² of green cover annually.
Phase 2 (2021–2024): Instead of slowing, consumption rose to ~59 km² annually.
The data indicates that the "development vs. environment" trade-off is becoming more aggressive, not less.
The Physics of the "Grey City"
Why does a 30% drop in vegetation matter to a "Smart City"? It comes down to urban physics.
1. The Thermal Trap (Urban Heat Island) Vegetation manages solar radiation through transpiration (releasing water vapor) and shading. Concrete and asphalt, conversely, absorb and re-radiate heat.
By removing 362 km² of vegetation, the city has effectively replaced its cooling mechanism with heat-retaining thermal mass. This explains the palpable rise in local ambient temperatures.
2. The Impervious Seal The vegetation lost included wetlands and soil-heavy scrublands—natural sponges for the city. When you replace 362 km² of "sponge" with "seal" (concrete), rainwater has zero infiltration capacity. This directly correlates to the increased frequency of flash floods; the water isn't rising, the ground just stopped drinking it.
The 2027 Horizon
The analysis concludes with a projected threshold. If the current burn rate continues, Bangalore will dip below 30% green cover by 2027.
In ecological modeling, dropping below 30% is often viewed as a tipping point where ecosystem services (natural air filtration, temperature regulation, water retention) degrade faster than they can recover. The city is three years away from testing this limit.
Summary: The satellite data paints a picture of a city growing at the expense of its own habitability. The "Smart Story" here is that Bangalore has mastered the code for software, but is currently failing the code for sustainable hardware.
About This Analysis
This analysis was conducted using publicly available satellite data from the ESRI Global Land Use/Land Cover Time Series (2017-2024), processed using Google Earth Engine. The methodology and data are transparent, reproducible, and available for independent verification. Administrative boundaries from FAO GAUL were used to ensure consistency. Cross-validation with Google Dynamic World dataset confirmed the findings.
All visualizations and analysis code available upon request.